The Most Spoken Languages in American Neighborhoods (Besides English and Spanish)

What language does your family speak around the dinner table?
While 78% of Americans only speak English at home, you may not know that it’s not an official language in the U.S. in the same way French is in France or Portuguese is in Brazil. English may be America’s de facto language (as the most commonly spoken), but millions of households across the U.S. use another language entirely.
In total, between 350 and 430 languages can be found in the States. After English, Spanish is the next most common, spoken by 62% of non-English speaking households — but what other languages might you hear from house to house in the U.S.? To find out, WordFinderX used Census data to discover the most spoken tongues (other than English and Spanish) across American neighborhoods.
What We Did
Within each U.S. state, major city and district of New York City, we used U.S. Census Bureau data to discover the prevalent language used in local households apart from English and Spanish.
Key Findings
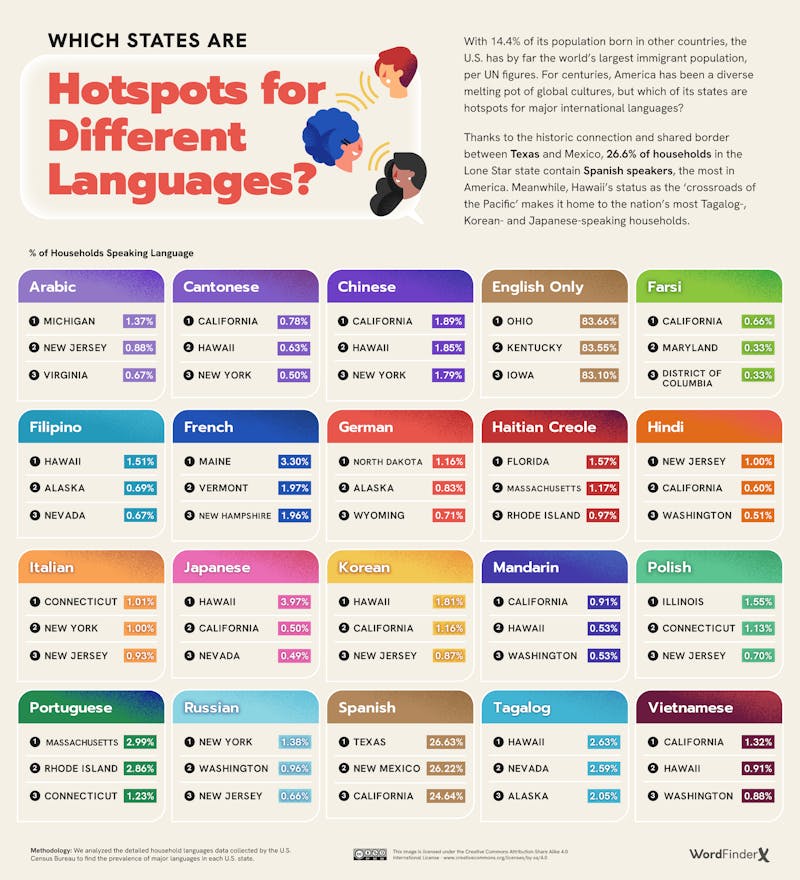
- German is the most spoken language (outside of English and Spanish) in 13 states — more than any other language
- Tagalog is the most spoken language in nine cities in the Western U.S.
- Chinese, Vietnamese and Arabic are the most spoken in major Southwest cities
- Chinese and Russian are spoken widely across New York neighborhoods
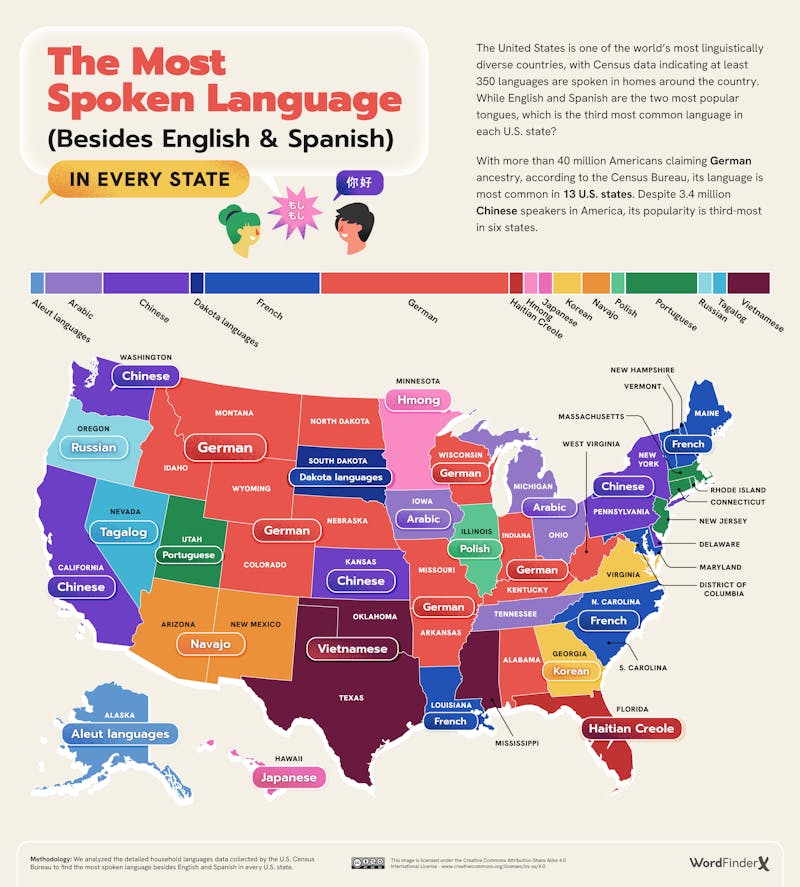
Two of these states (North Dakota and Wisconsin) are notches on the country’s “German belt,” areas of the U.S. where German immigrants historically settled. Wisconsin, in particular, counts the largest proportion of residents who identify as German.

Meanwhile, Vietnamese and Chinese are the most common languages (outside of English and Spanish) in four cities apiece. Two cities where Chinese is popularly spoken (San Francisco and Seattle) boast significant Chinese-American communities as a result of immigration.
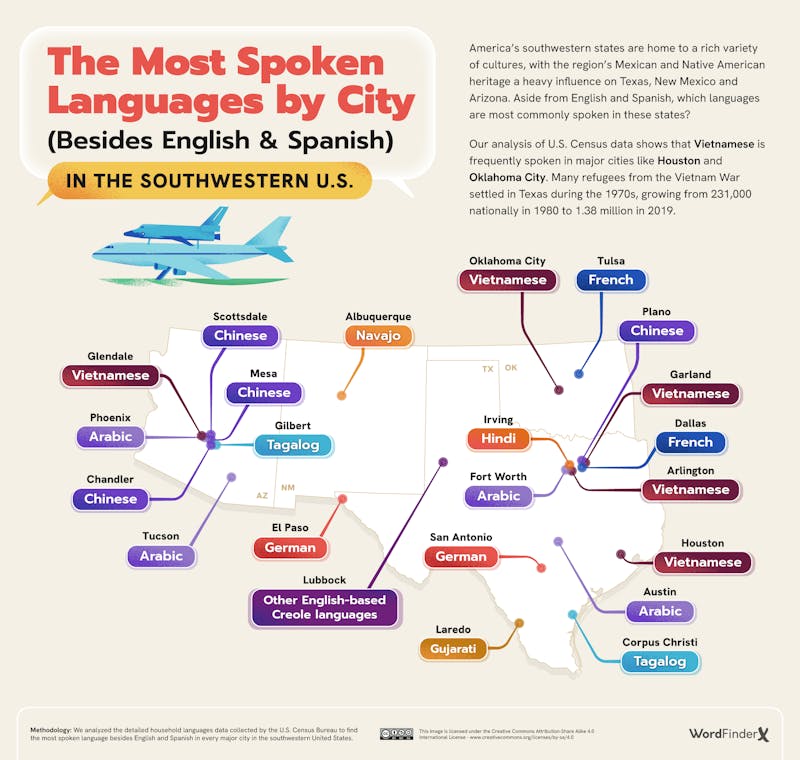
Other languages spoken the most in Southwest households include Arabic, Chinese, French and German. Over in Albuquerque, Navajo takes the top spot, a language used by the Navajo Nation tribe that lives on the largest reservation in the country, partially spread over New Mexico.
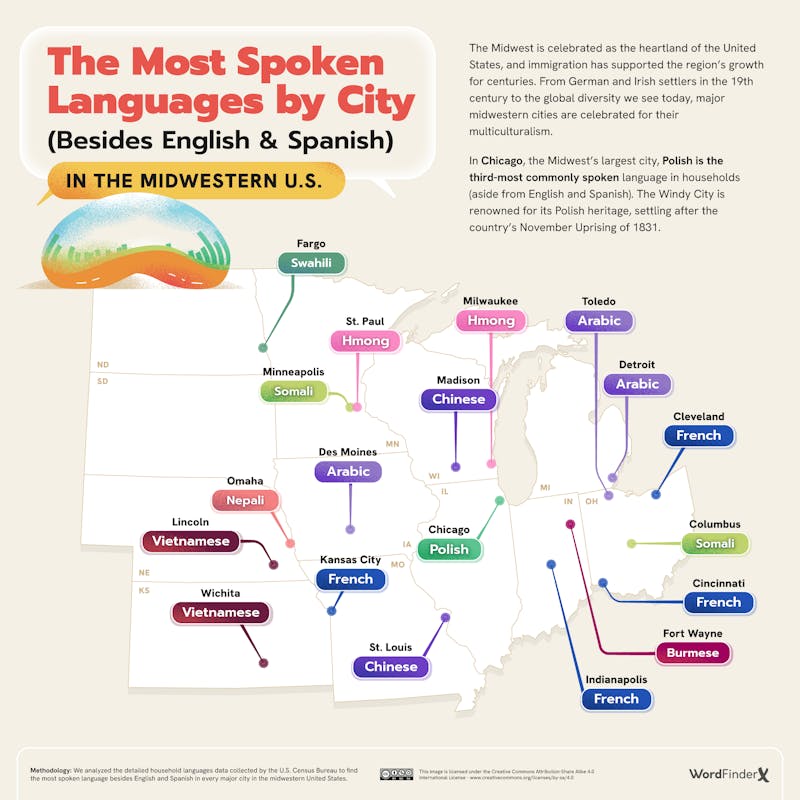
Across the Midwest’s major cities, the most spoken languages locally (aside from English and Spanish) range from Arabic and Swahili to Burmese and Nepali. Polish is the most spoken language in Chicago (IL), labeled America’s “traditional capital of the Polish diaspora” by Culture.pl.
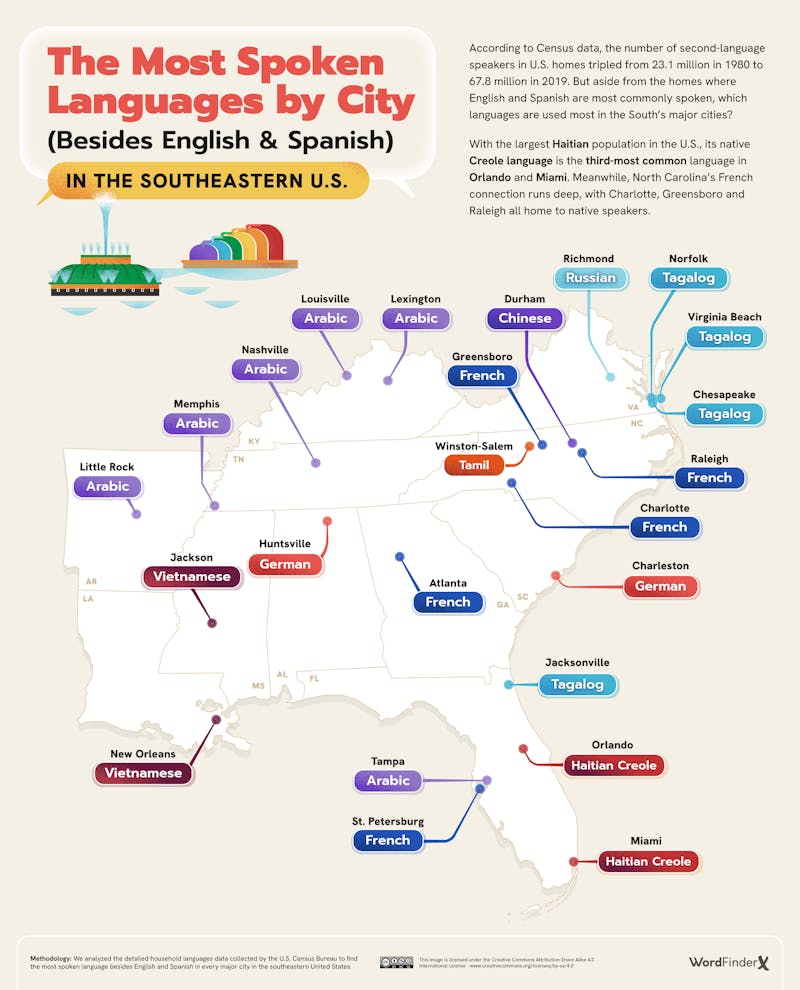
Haitian Creole is the most spoken language in two Florida cities (Miami and Orlando), the state home to the largest population of Haitians. Tens of thousands of Haitian immigrants settled in Florida — some 800 miles away from Haiti — following the country’s devastating 2010 earthquake.
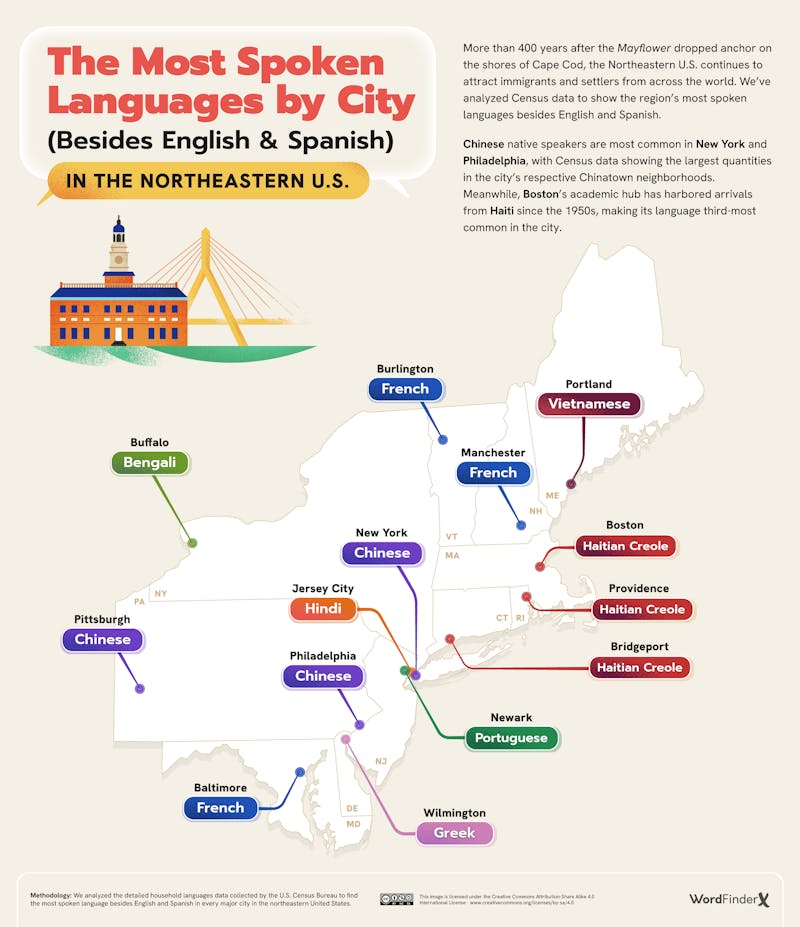
Hindi comes top in Jersey City (NJ), where you’ll find India Square, home to one of the Western hemisphere’s largest concentrations of Indian people. Meanwhile, French is the most spoken language (outside of English and Spanish) in Baltimore (MD), Manchester (NH) and Burlington (VT).
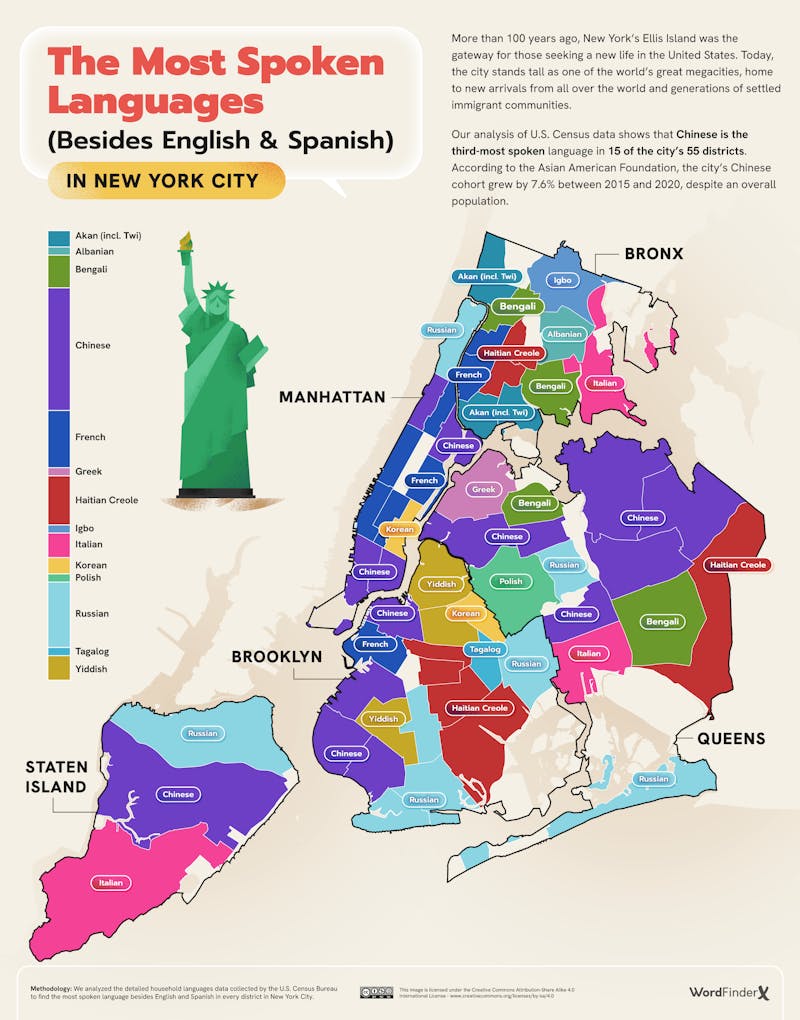
Russian takes the top spot in eight other neighborhoods, including Brighton Beach, which in the late sixties saw an influx of Soviet and Ukrainian immigrants for whom the area was reminiscent of the city of Odesa by the Black Sea. Italian is the top language in three other neighborhoods, including Howard Beach, where half of the population is either Italian or claims Italian ancestry.
While many languages across America are thriving (Spanish, for example, is projected to count 138 million speakers in the U.S. by 2050), some are on the verge of extinction. These include rare regional dialects, like the aforementioned Pawpaw French in Minnesota, and indigenous languages that count just a handful of speakers, like the critically endangered Arikara language of the Arikara Native American tribe in North Dakota.
The good news is that work is being done all across the country to keep endangered languages alive. One example is the Caddo language of the Caddo Nation of Oklahoma, which — after losing five of its seven remaining fluent speakers during the COVID-19 pandemic — is now being passed onto children in a new childcare program. Technology is also on hand to help out, with various apps on the market designed to preserve and educate people about endangered tongues the world over through seamless interactive gadgets. From word finder tools and language quizzes to virtual conversation partners and pronunciation guides, the array of available resources caters to diverse language learners.
How We Did It
We analyzed the "detailed household languages" data by state, city and NYC districts from the U.S. Census Bureau, specifically the "ACS 1-Year Estimates Public Use Microdata Sample" and the state equivalent. Within each U.S. state, major city and district of NYC, we specifically chose the most prevalent household language apart from English and Spanish.
The U.S. Census Bureau defines “detailed household language” as the language assigned to the household based on the non-English language reported by those living in the household. If it is a single-person household, the household language is the language reported for that person. If there is more than one language spoken in the household, the household language is assigned in the following order (based on the relationship to the reference person) — (1) reference person, (2) husband/wife, (3) son/daughter, (4) brother/sister, (5) father/mother, (6) grandchild, (7) in-law, (8) other relative and (9) other non-related household members.
The data collection took place in May 2023. This analysis is correct as of July 2023.